


Key Resources
Press release

Five oil majors risking 30% of potential investments on projects ‘unneeded’ in a 2⁰C world
Read More2018 Update

2 Degrees of Separation: July 2018 Update
Infographic
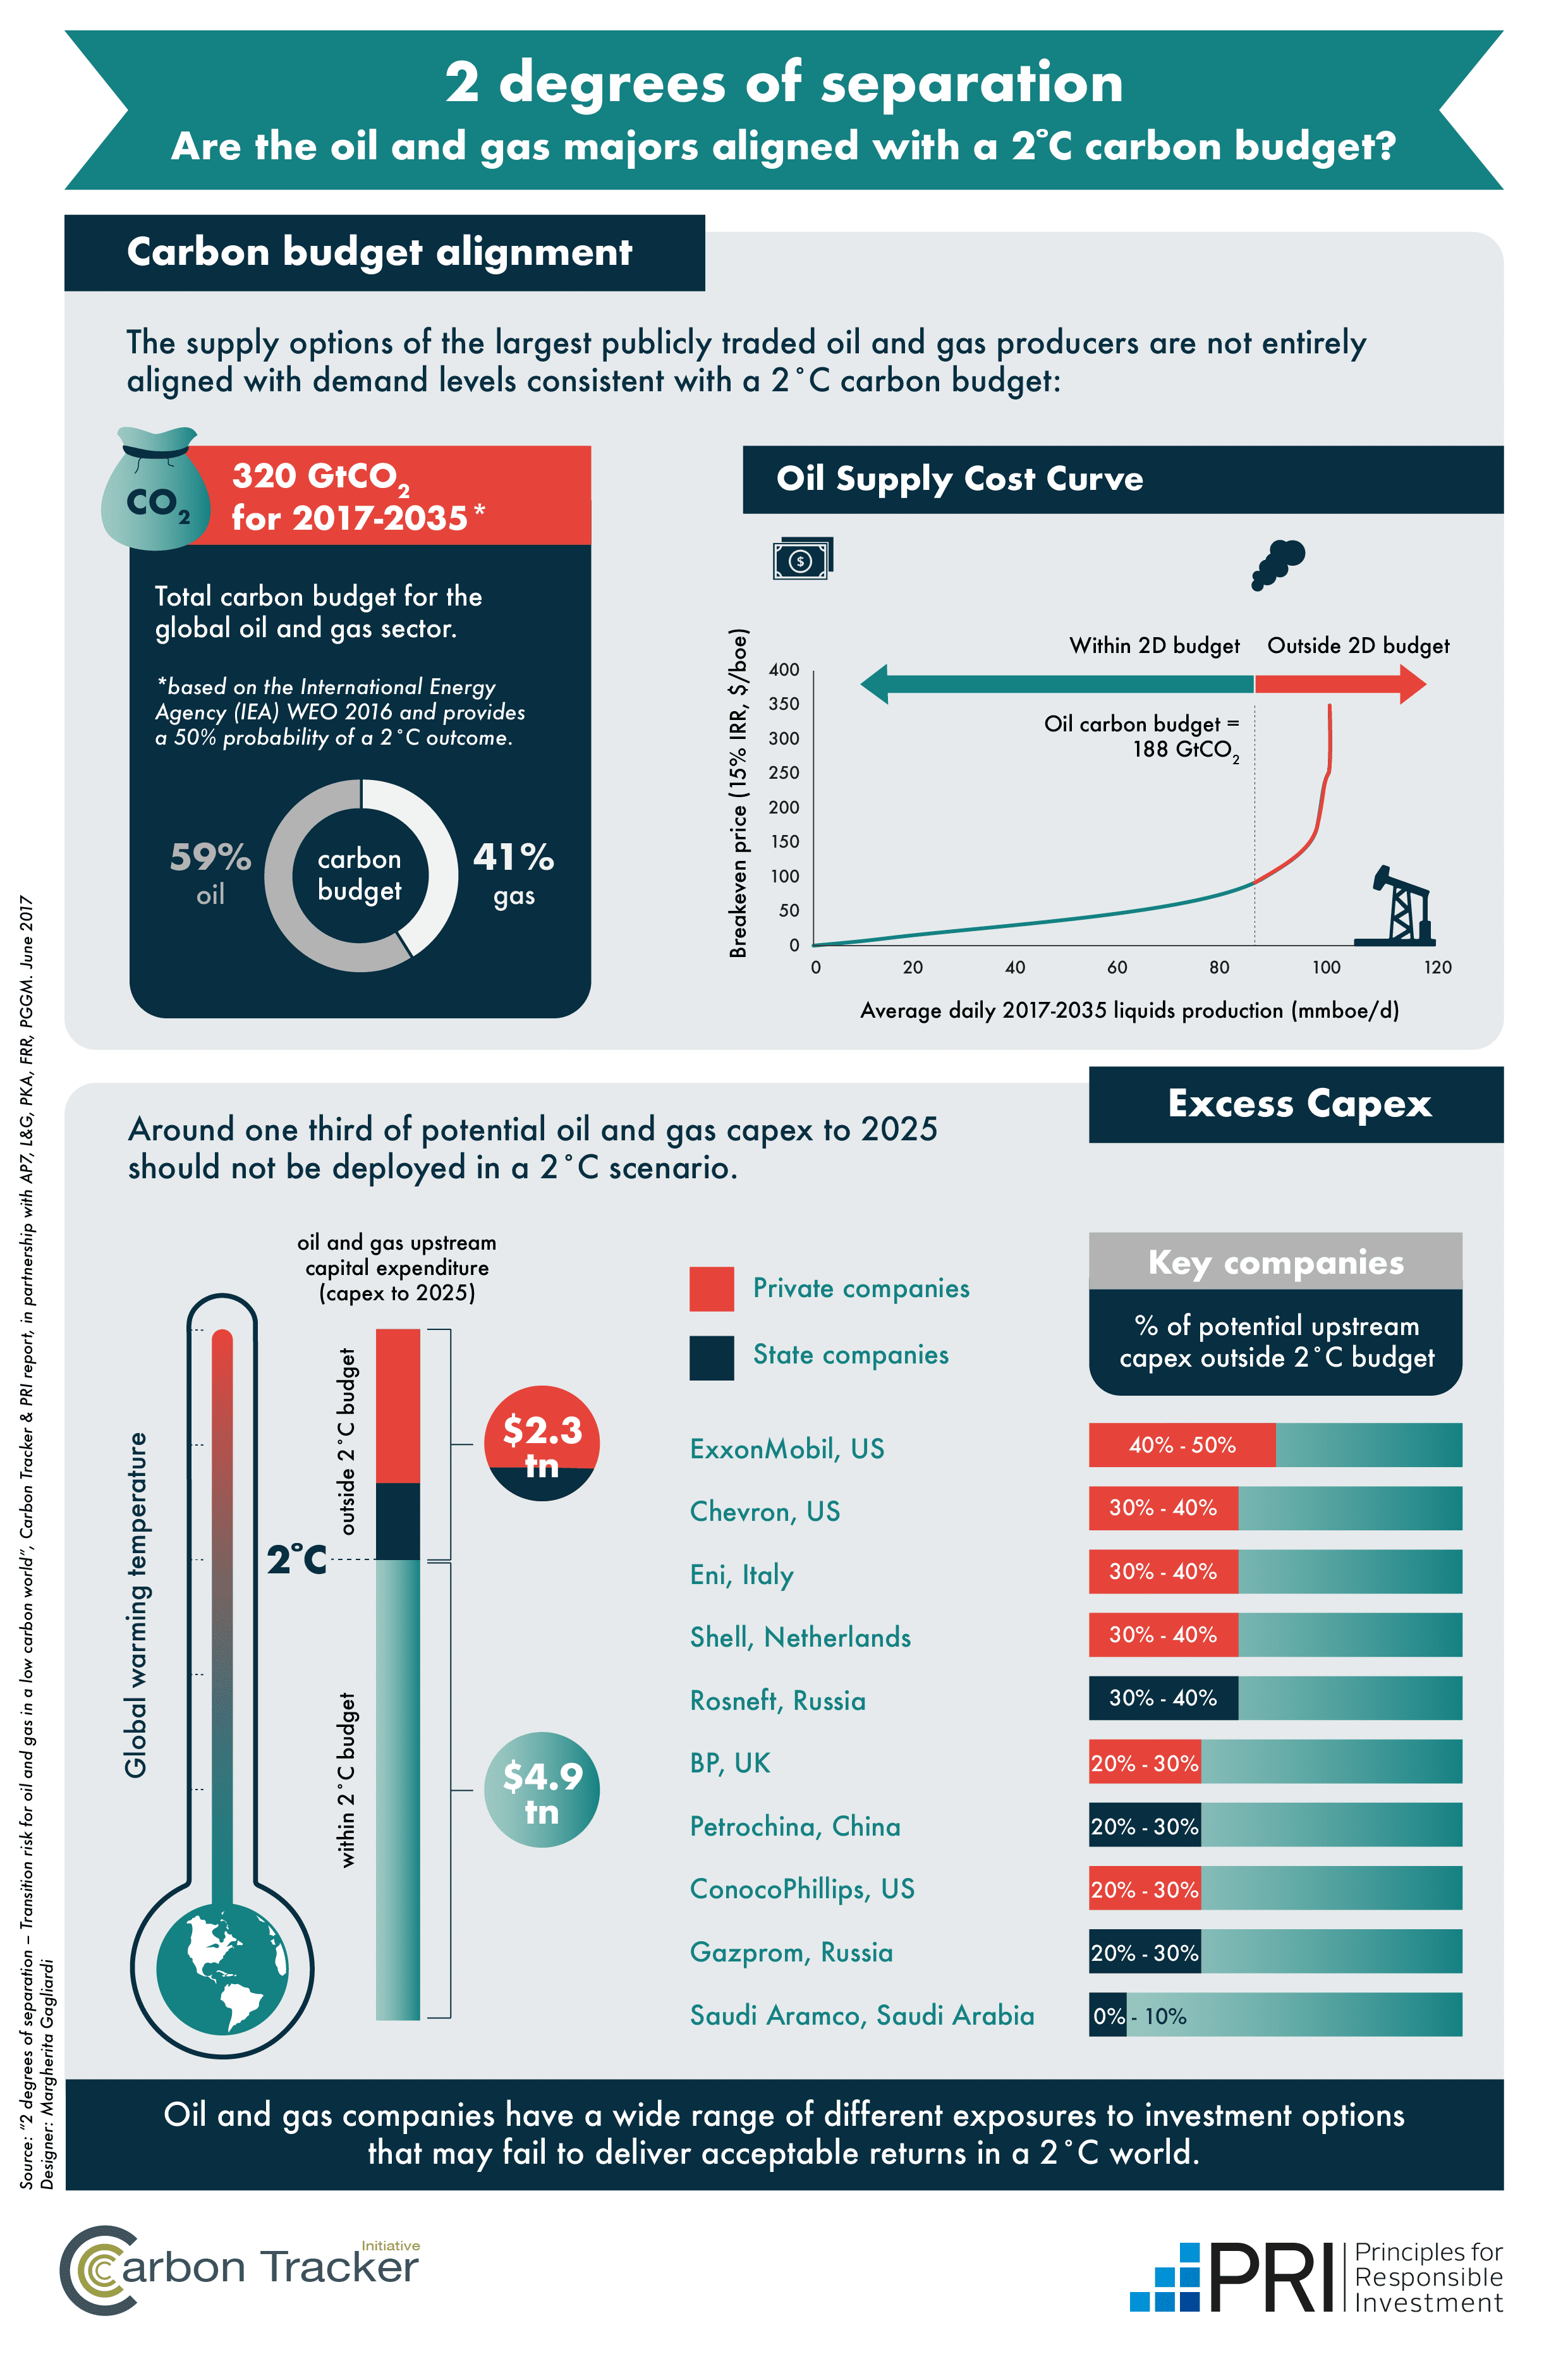
Are the oil and gas majors aligned with a 2°C carbon budget?
Download ResourceMethodology report

Key Term

Carbon Budgets
Read MoreKey Quotes
Explore the report webpage: 2degreeseparation.com
This report, produced by Carbon Tracker, Principles for Responsible Investment (UN PRI) and leading institutional investors, is the first to rank 69 of the biggest oil and gas industry companies according to the extent of their exposure to the low-carbon transition. It provides a way of understanding whether the supply options of the largest publicly traded oil and gas producers are aligned with demand levels consistent with a 2˚C carbon budget, and will equip investors with the authoritative information they need to challenge companies on their investment strategy and approach to climate risk.
It finds that across the oil and gas industry $2.3 trillion of upstream projects – roughly a third of business as usual projects to 2025 – are inconsistent with global commitments to limit climate change to a maximum 2˚C and rapid advances in clean technologies.
The study offers a sophisticated tool to investors to align their capital allocation decisions with the company’s exposure to climate risks.
Key Findings
Carbon budget alignment: company by company
This new analysis provides a way of understanding whether the supply options of the largest publicly traded oil and gas producers are aligned with demand levels consistent with a 2 degree Celsius (2D) carbon budget. By allocating the carbon budget to potential oil and gas projects, through applying the economic logic of a carbon supply cost curve, it is possible to identify which companies have the highest exposure to potential capital expenditure (capex) to 2025. This report provides a snapshot of the potentially unneeded capex spend for 69 global oil and gas companies – highlighting for the rst time, the wide- ranging degree of exposure amongst companies in the sector.
Excess capex
The analysis shows that:
- US$2.3trn – around one third – of potential capex to 2025 should not be deployed in a 2D scenario compared to business as usual expectations.
- Company level exposure varies from under 10% to over 60% when considering the largest 69 publicly traded companies.
- Around two thirds of the potential oil and gas production which is surplus to requirements in a 2D scenario is controlled by the private sector.

On the rebound?
Capital expenditure has dropped in recent years as a response to the lower oil price. In order to align with a 2D scenario, the level of capital deployment should not rebound from 2016 levels across the industry as a whole. Under a business as usual scenario, with rising prices, investment ramps up again. This would create nancial exposure to projects not consistent with peaking emissions in the near future.
2D scenario
This analysis utilises the oil and gas demand levels indicated by the International Energy Agency’s (IEA) World Energy Outlook 2016 450 scenario as a proxy for a 2D scenario. For the period 2017-2035, this equates to a total carbon budget for oil and gas of 320Gt of CO2, split 59% for oil and 41% for gas. This is at the higher end of the range of carbon budgets that could be applied, as it only provides a 50% probability of a 2D outcome. If one were to try and align with limiting global warming to below 2D, or apply a higher likelihood of the outcome then this would provide an even tighter constraint on future oil and gas supply and demand.
Identifying the potential winners and losers
This analysis focuses on the metric: “percentage of potential capex outside 2D budget”. This can effectively give investors a sense of what proportion of the company’s investment plans may fail to deliver an acceptable return in the scenario of a world limited to 2°C global warming outcome (i.e. which project capex is within budget and which is “unneeded”). This can be interpreted in different ways according to investment strategies and policies.
In terms of risk management, some investors may prefer a degree of optionality – but the higher the level of unneeded capex, the more growth strategies would have to be tempered. For investors seeking to align with a 2D scenario, it is clear that some companies are better positioned than others.
Find more here.